Skip to Main Content

Infographics: What is an Infographic?

What is an Infographic?

An Infographic is a visual (graphic) representation of data and knowledge (info) designed to present complex ideas quickly and clearly while following a narrative. 

Simply stated, an infographic uses text, illustrations, data visualization and layout to tell a story. 

Good infographics make information understandable, memorable, and actionable

Simply Stated

An infographic uses

  • text
  • illustrations
  • data visualization
  • layout

      to tell a story. 

Good infographics make information

1. understandable

2. memorable

3. actionable

- Randy Krum, CEO of InfoNewt and author of Cool Infographics

Anatomy of an Infographic

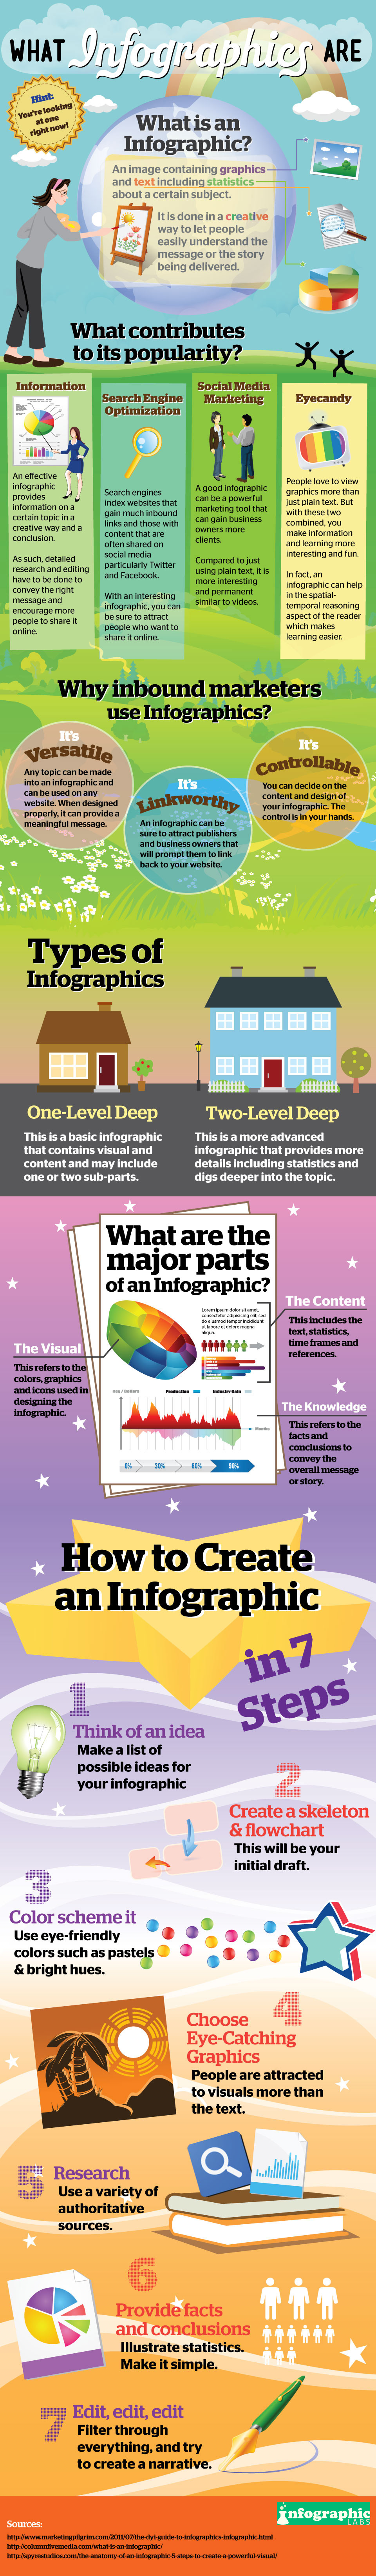
An Infographic has 3 core components:

  1. Visual: color coding, graphics, reference icons
  2. Content: time frames, statistics, references
  3. Knowledge: facts, deductions

One-Level Deep Infographic: a simple design that barely skims the three core components

Two-Level Deep Infographic: an advanced design that employs both theme graphics and reference graphics, data, references, and statistics, as well as icons, image holders, shape groupings, etc.

​5 Essential Steps to a Good Infographic:

  1. Skeleton & Flowcharts - map itout on paper first!
  2. Color Scheme - devise a color scheme to enhance your message
  3. Graphics
    • Theme graphics such as a defining visual are required and will anchor your message
    • Reference graphics such as icons are not mandatory, but, can replace text when well-used. 
  4. Research & Data
    • Include most relevant data
    • Data to graphic ration should be 1:1
    • Consider your audience and use appropriate colors, icons, knowledge and complexity.
  5. Knowledge - highlight important information to lead people to easily provoke deductions.

- Sneh Roy http://spyrestudios.com/the-anatomy-of-an-infographic-5-steps-to-create-a-powerful-visual/

Other Considerations

 Questions to consider as you begin to design your infographic:

  • What is the theme? 
  • Who is the audience? 
  • What is the key message? 
  • What prior knowledge is needed?
  • How will you tell the story? 
  • Where will you find the information (which sources will you use)? 
  • Are you using data? Are you collecting your own data? If yes, how will you analyze it? 
  • What tools will you use to visualize the data?
  • What platform do you want to use to build the infographic?  

What Infographics Are